

Wishing our readers were in receipt of an enjoyableness during August, we continue with our regular writing after the summer break. Bear with us for this post will be more abstract than usual.
Nothing like price action to change sentiment. We have been structural gold bulls (bugs?) since inception, as we have metnioned many times before. So with current prices breaking all time highs we’d like to revisit the question we asked a year ago in Notes from the 2e: Why it is that this chart is mean reverting rather than trending?
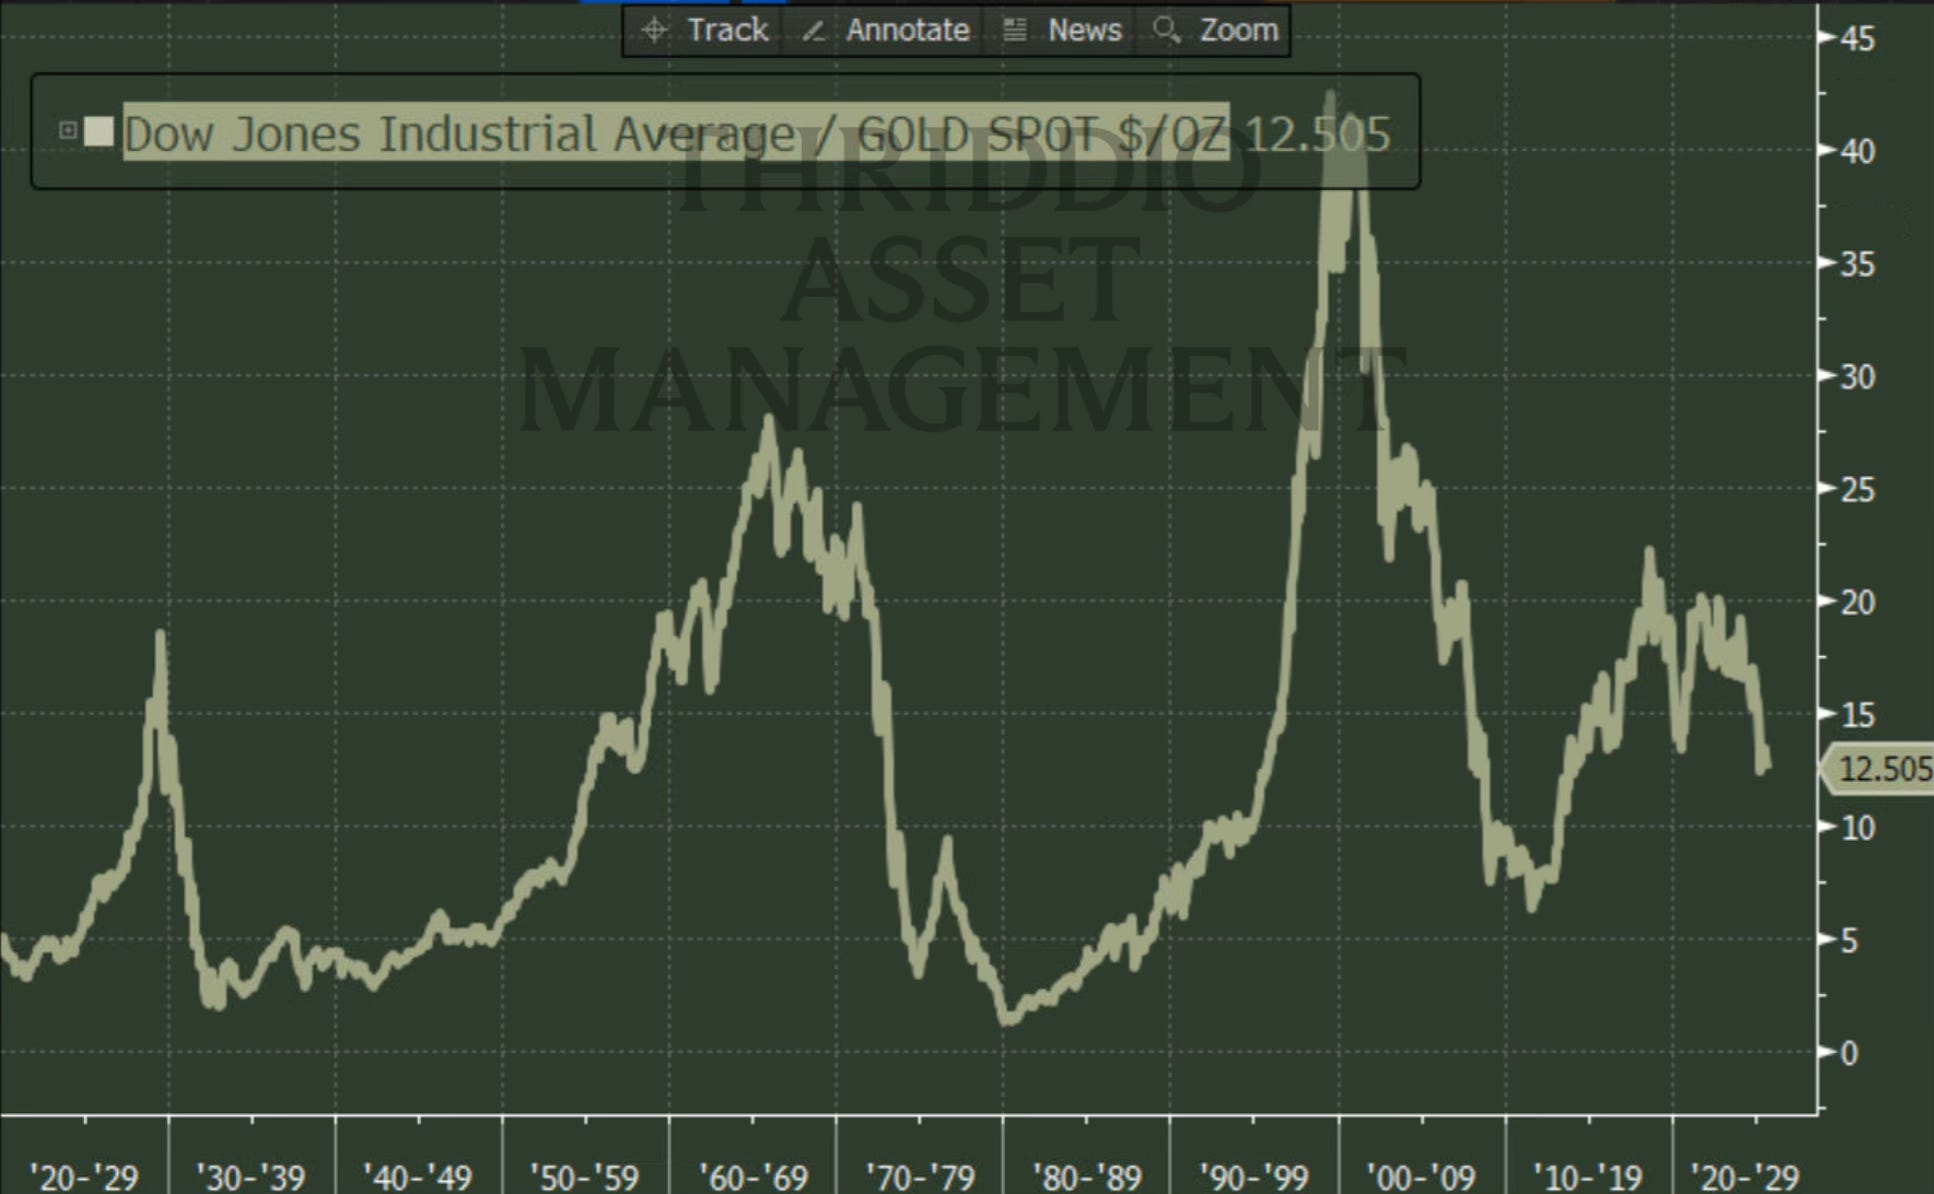
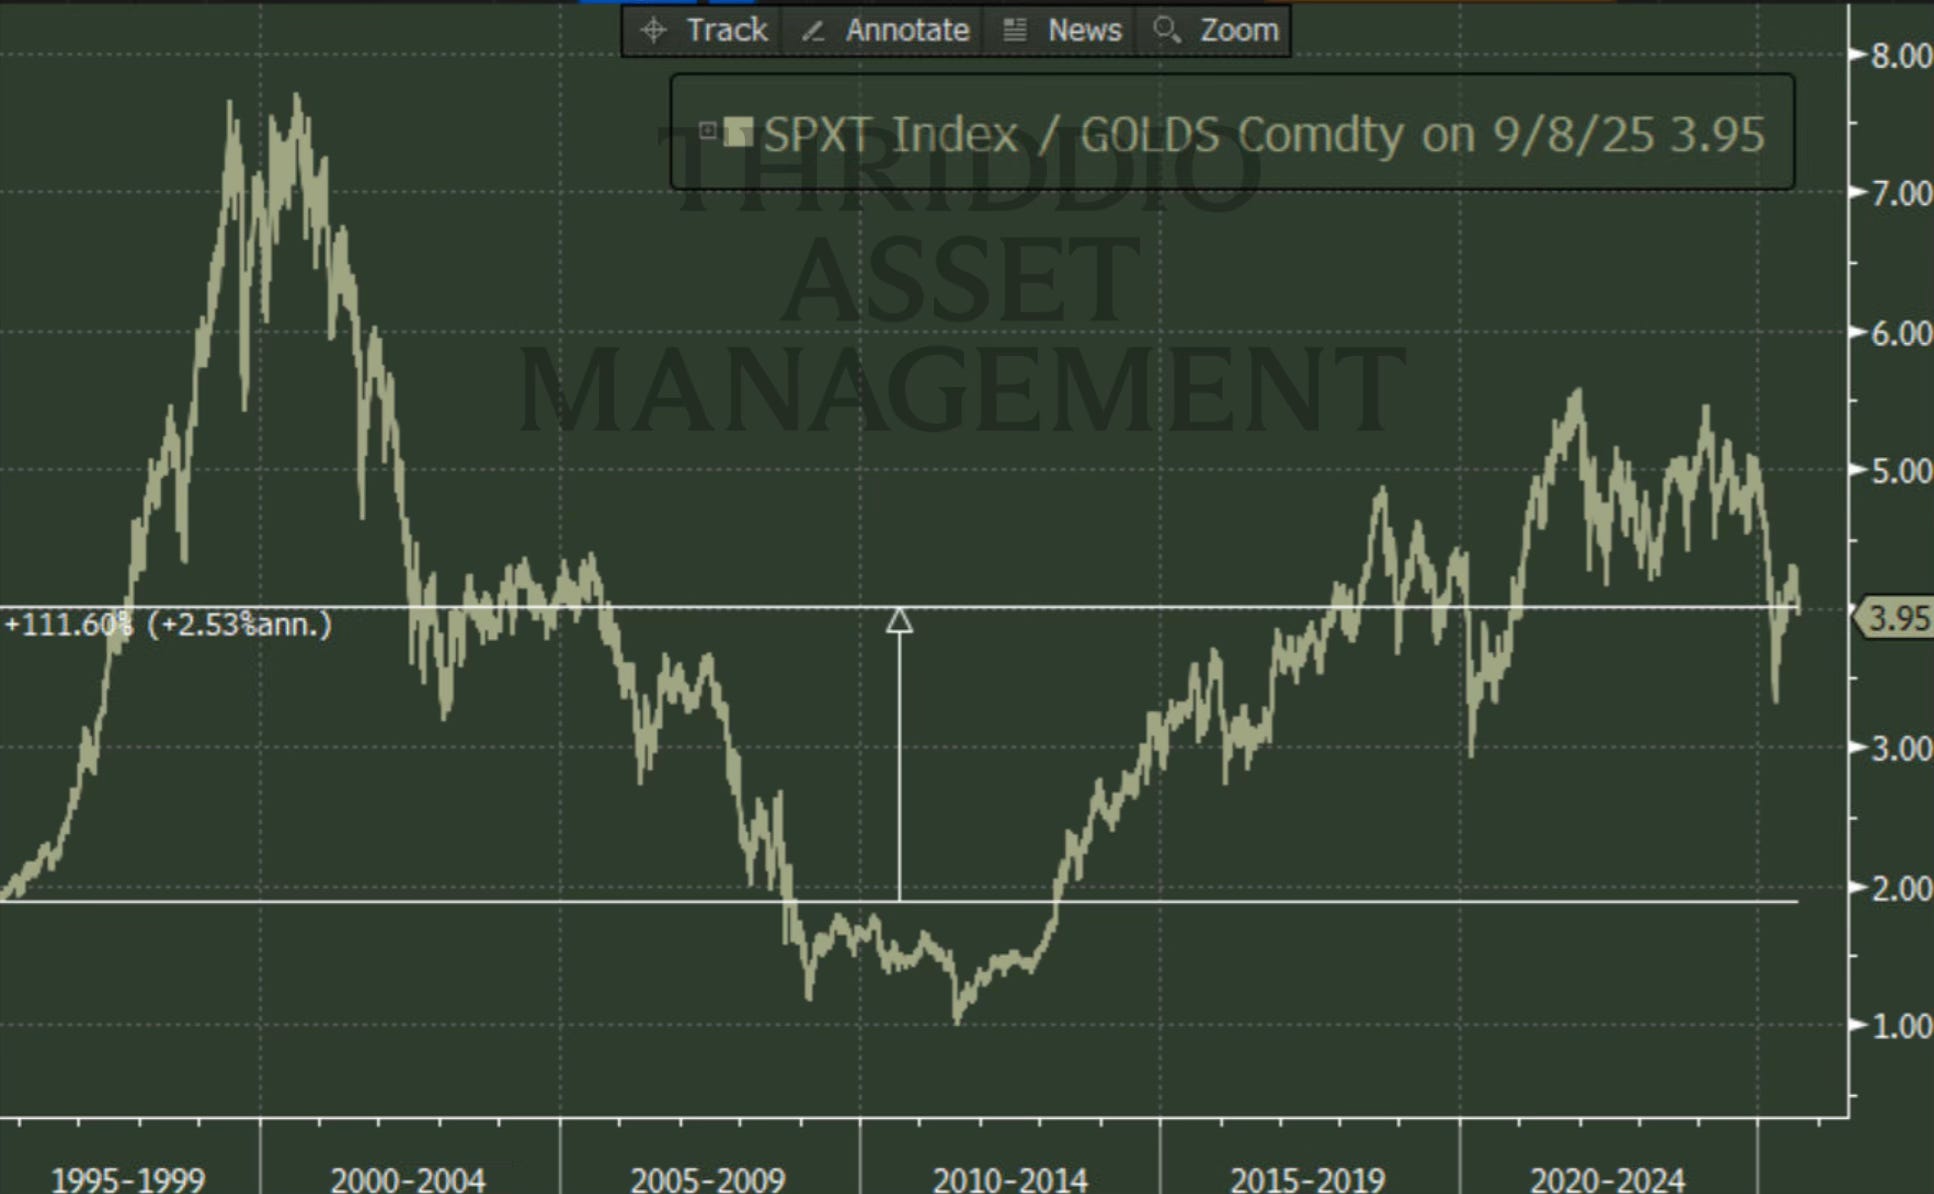
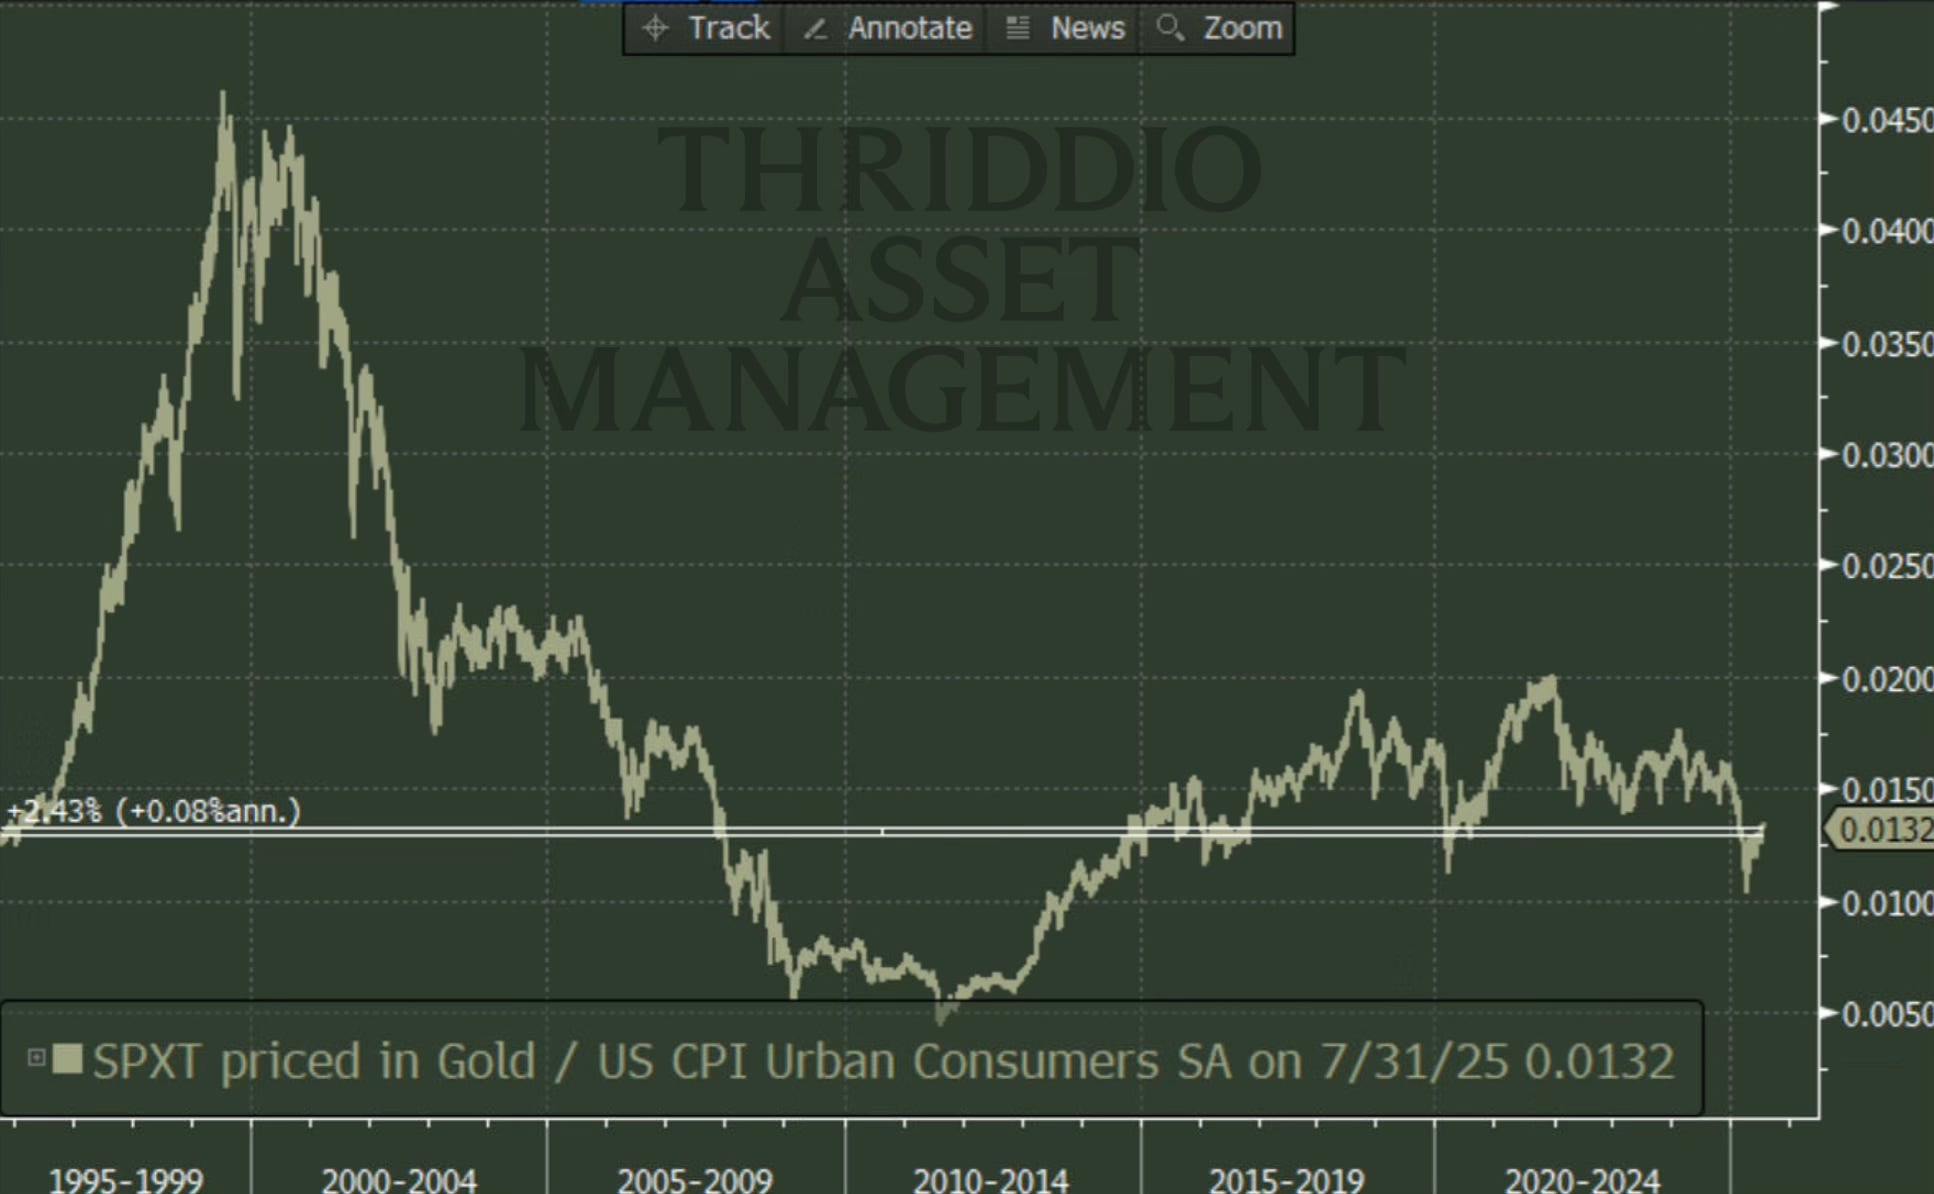
Namely, how can the most industrious and innovative companies in the world’s largest economy, barely outperform the price of gold over the last 100+ years? these companies create goods and services, jobs, trade, etc. Yet their performance vs gold is mediocre, even for the last 30 years the SP500 total return merely outperformed by 2.5% a year.
It really makes one wonder, where is the added value? is it really a mere 2.5% vs hard money?
The fact that we use an expanding unit of account in the denominator (fiat) is helpful to debtors at the “cost” of savers, or is it?
By devaluing the currency over time nominal debts ease away. However, investment (financed by debt) is needed to develop means of production, infrastructure, etc. When one looks at the charts of purchasing power of the USD or any fiat currency for that matter, the chart always looks like so:
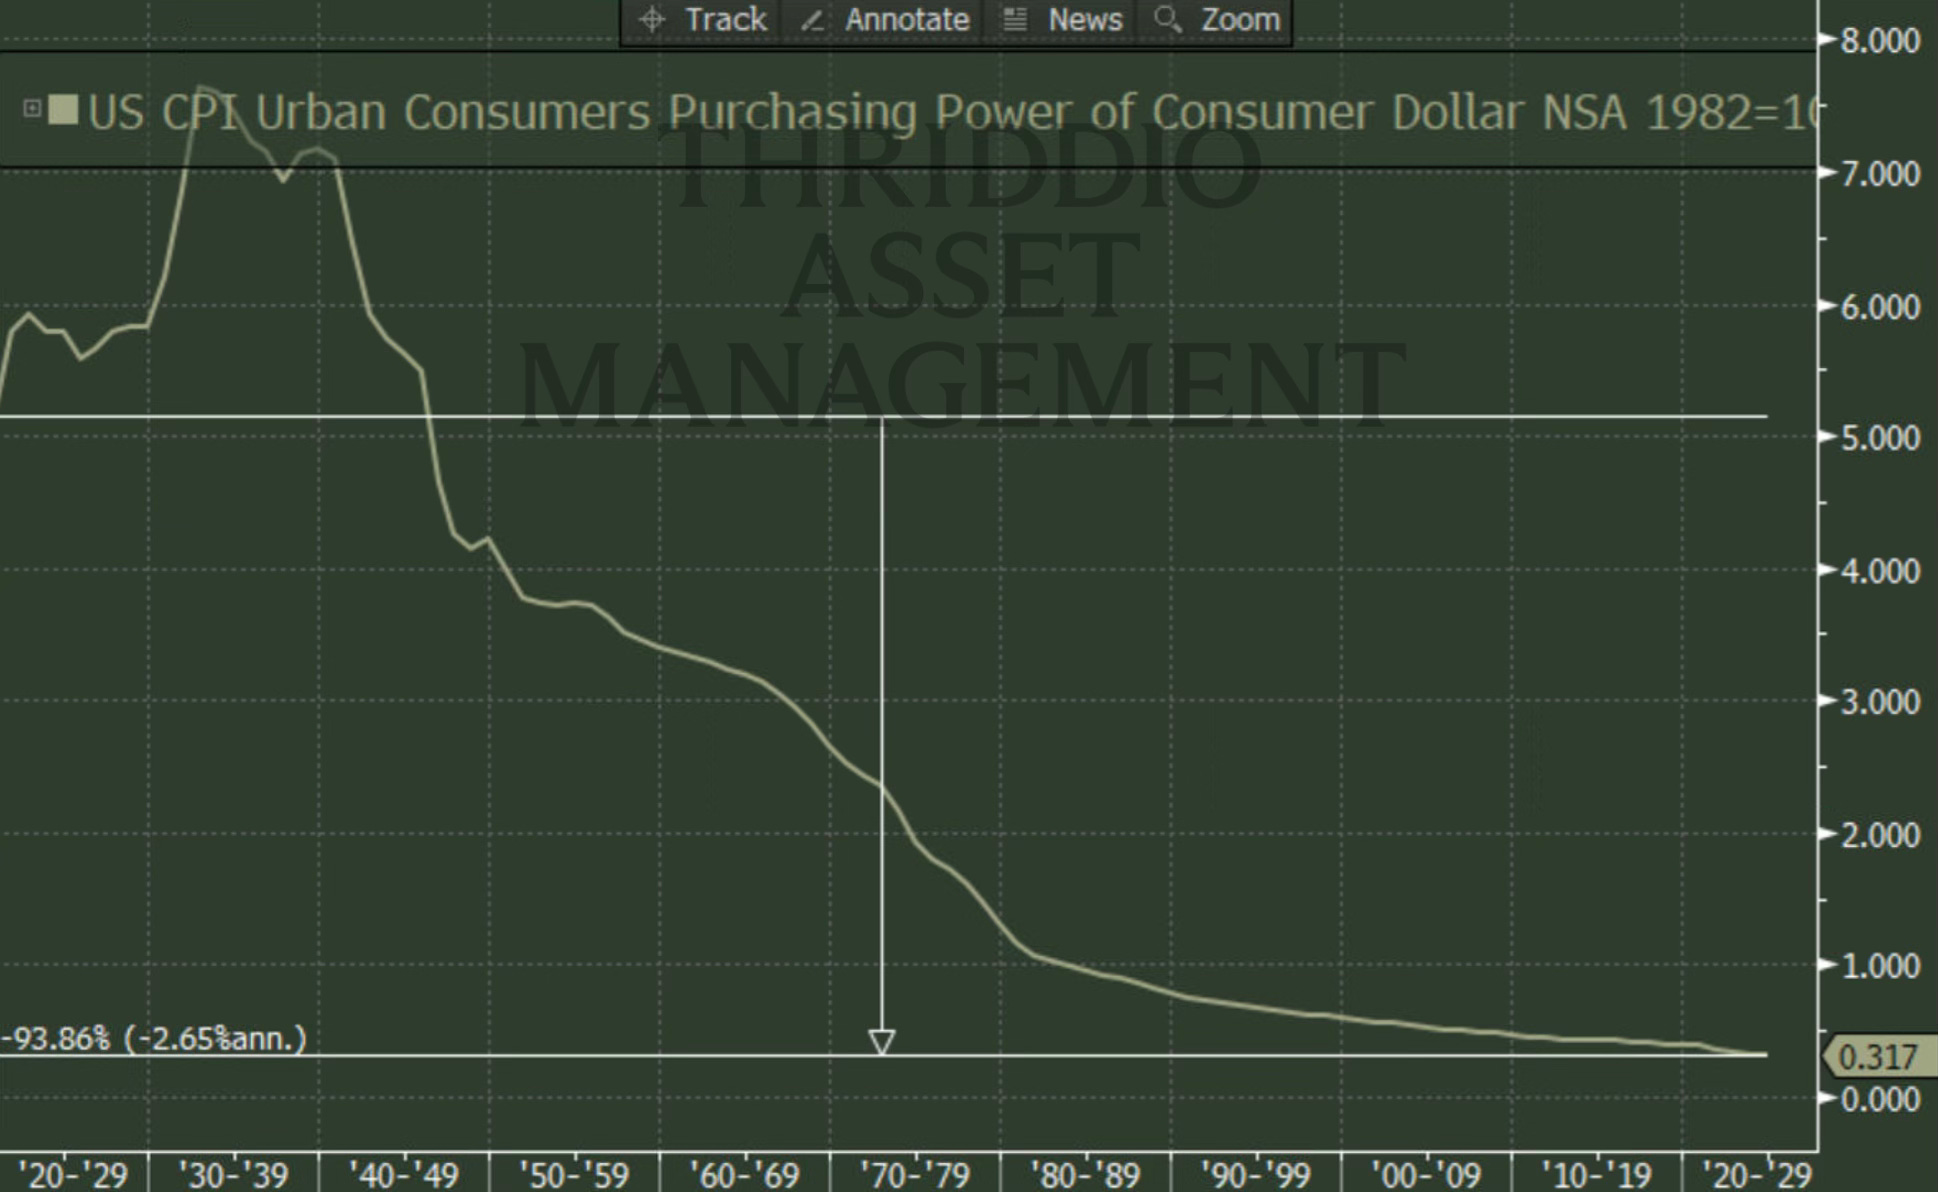
But how can it not? We are many more people alive now than back then. Production output is 1000s of times what it was back then. Have a stroll down any city centre and think about the volumes and amounts of goods and services exchanged today and imagine that same place a mere 50 years ago. The unit of account MUST expand. Repaying debt would be significantly more challenging if it were issued in hard money, repaying it in real rates is difficult enough depsite CPI being often generously marked down. Now interestingly enough, the long term real total return of US treasuries, is, drumroll… *2.5%*.
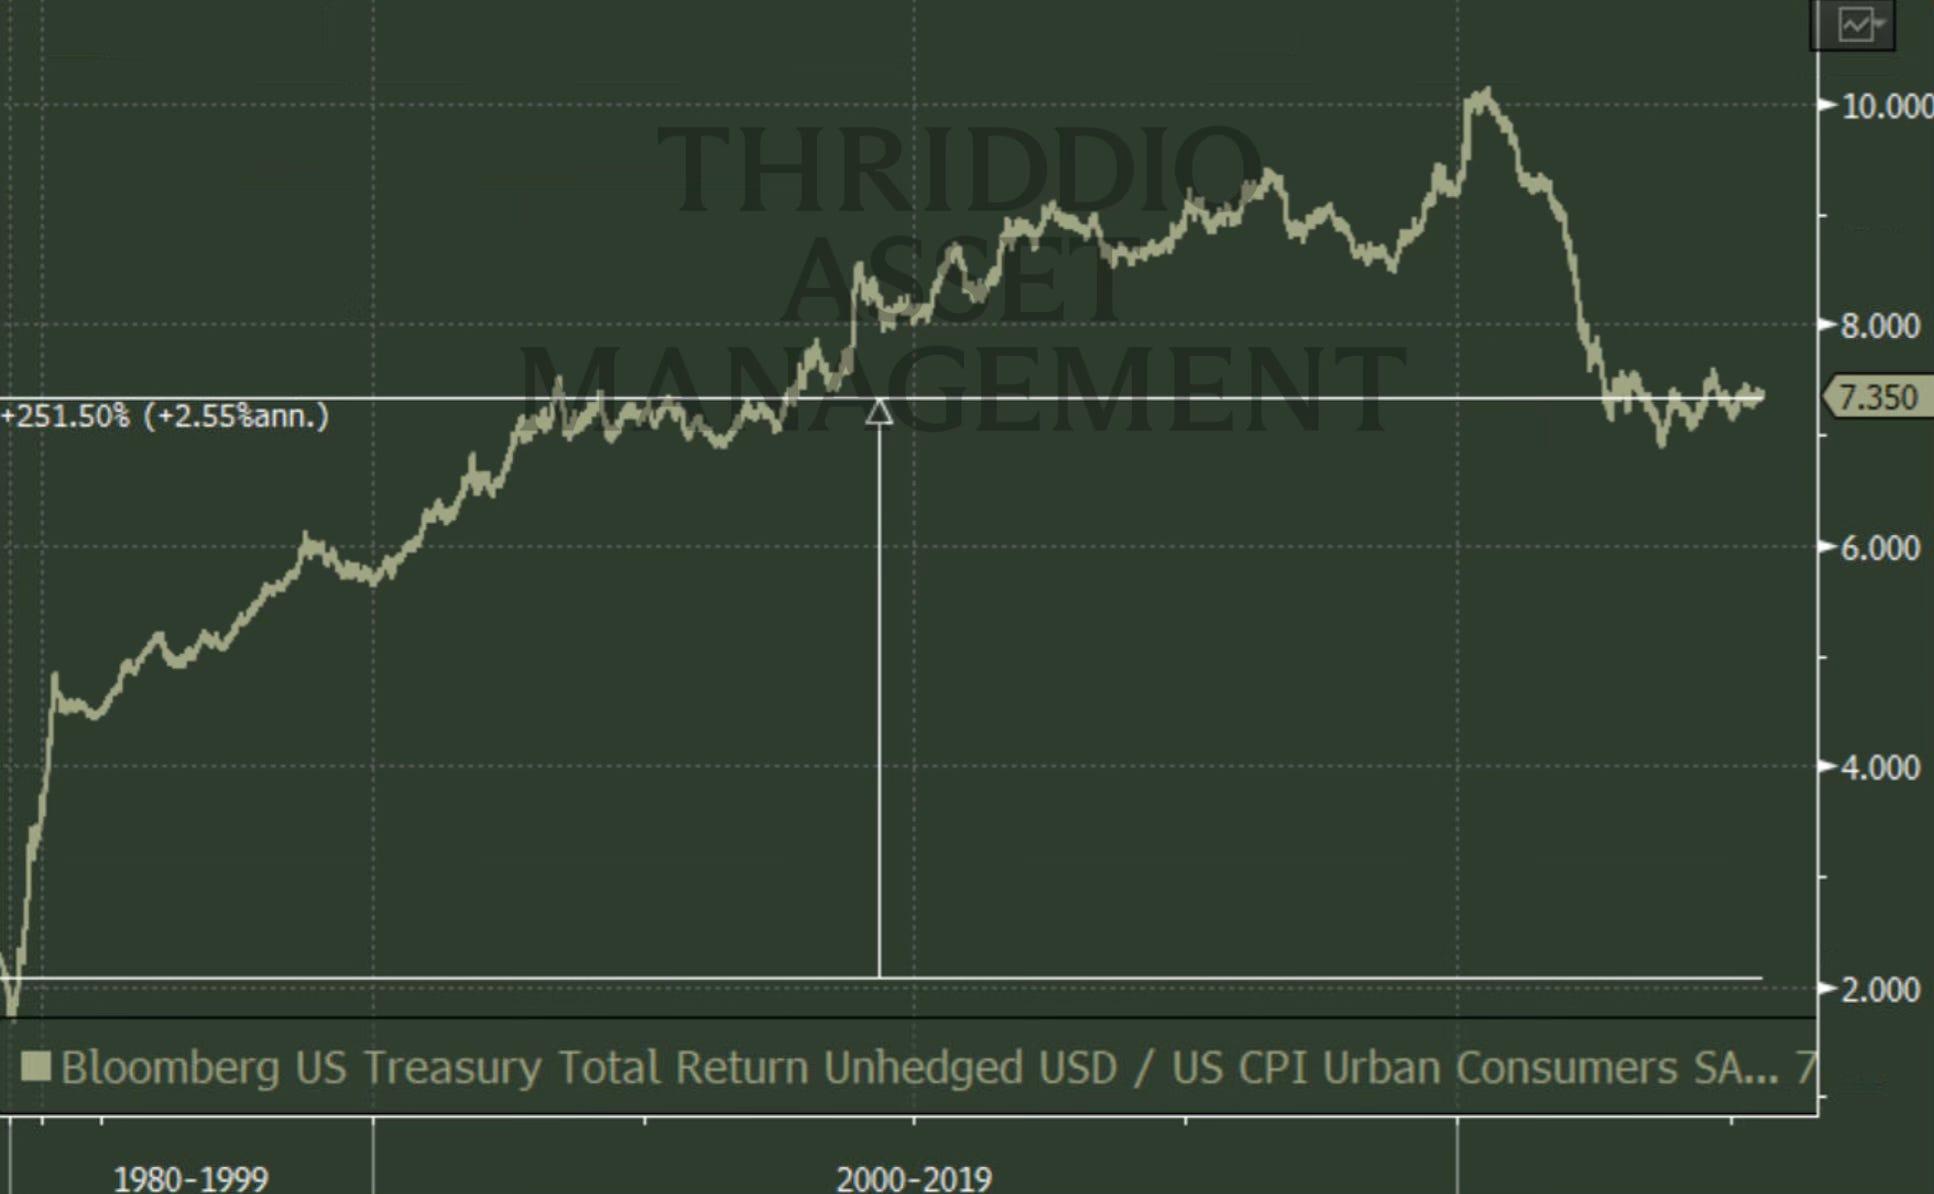
Wait what? same 2.5% as equities vs hard money? and same as the loss of purchasing power of the denominator? How interesting isn’t it? Also note that SP500 total return in gold / CPI = 0. Yes, zero. Now this is probably above our paygrade but we always like it when financial theory clashes with reality, the fact of the matter is this has gone nowehere over the past 3 decades:
We will let economists explain this. And also recommend listening to Russell Napier’s podcast with Felix Martin on Money - The Unauthorised Biography
For us as portfolio managers what we need is to decide on how to position ourselves for where we think things will go in the future. The strenght with which gold has pierced through all time highs is good for our remaining gold position but concerning for the signal it sends, it looks like it is beginning to go parabolic in all but latin american currencies (COP, BRL, MXN) where it is still below April’s highs.
Since our last note we have not changed our positioning significantly, we sold our RIOT 0.00%↑ well above our target at just over 13.5 handle (target was 11sh), we sold some gold (regrettably), and we added MXN nominal 10yr which we got at auction, that is investment grade with a juicy 10% coupon, yes please. Enquire within for details on how to execute that trade.
We understand this note was a bit too abstract and prone to different interpretations, nonetheless we find this discussion most intellectually stimulative. We will continue with our regular writing into year end.
This is for informational purposes only, it should not be considered as investment advice and does not constitute any offer or solicitation to subscribe or redeem. Investment involves risk. Please consult a licensed investment professional before taking investment decisions.
All charts and graphs copyright © Bloomberg Finance L.P.